X

TXTWRK


PERSONAL
LinkingLinking
FollowingFollowing
ConnectionsConnections
MessagesMessages
NotificationsNotifications
DISCOVER
SearchSearch
ReelsReels
CalendarCalendar
MapMaps
Work
NotesNotes
NeedsNeeds
ContributionsContributions
TimetableTimetable
IntelIntel
To DosTo Dos
ChecklistsChecklists
SavesSaves
ScrapboardScrapboard
LinksLinks
Monetisation
CoinsCoins
AdvertisingAdvertising
SubscriptionSubscription
DonationDonation
Log BookLog Book
Organisation
BusinessBusiness
AddressesAddresses
InvestorInvestor
FinancialsFinancials
Quarterly'sQuarterly's
SharesShares
Server
ServerServer
WorkspaceWorkspace
Code PlaygroundPlayground
Learn More
AboutAbout
AIDAID
DataData
DevDev
Web ImpressionsImpressions
ToolsTools
EducationEducation
SafetySafety
ReaderReader
My Content
Profile Image
Login

My Addresses

×
Addresses
+
Character Profiles
+
Info & Cover
+
Timetables
+
Favorited by... X
Link Clicks X
All comments... X

Tee Aries

@TeeAries


Learn more about me 𓇻
▦ Photos
▦ Videos
▦ Covers
Active: Feb 07, 2026
Safety


LOCAL PULSE

Profile Signals

Loading…
Loading profile signal…

Loading latest public Local Pulse signal…

Financials Financials
Quarterlys Quarterlys
Shares Shares
Notes Notes
Needs Needs
Contributions Contributions
Timetable Timetable
Intel Intel
To Dos To Dos
Notes Reel


Happening & Service
Happening Now and service updates connected to this profile


Connections
These are pages I added


Loading media...
DOUBLE TAP TO OPEN
•DERBY COUNTY FC
•2025


@TeeAries


Topic: Loved
⛶
Neutral
FAREWELL FROM TXTWRK TO ANDI WEIMANN (see you next season)

Andi Weimann has sealed a move from Derby County to Rapid Vienna on a loan deal until the end of the season.

The Austrian has made an emotional return to the club where he spent two years as a youth player.

Derby had initially knocked back Vienna's move for the forward this week, but the late arrival of Sammie Szmodics from Ipswich on deadline day prompted a rethink.

And with Weimann vying for a place in Austria's World Cup squad, Derby recognised that regular games would help achieve that goal and subsequently allowed the move.

Weimann has been a fine addition to Derby's squad after they signed him on a free transfer from Blackburn last summer and he scored the only goal of the game in a victory at West Brom earlier in the campaign.

His contract at Derby is due to expire this summer, but the club does retain an option to extend it by another 12 months.

It is understood there is no obligation for Vienna to buy the forward once his loan deal has ended.

So its with that i would like to say, straight from @TeeAries lips, HE WILL BE BACK WITH MORE EXPERIENCE!!

COME ON YOU RAMS

#DERBYCOUNTY #TXTWRK #FOOTBALL #NEWS

🗖 VIEW
Is this a good move Andi Weimann?
Select up to 1
2 people have voted
DAMN RIGHTY!
2 votes
HELLL NAAAA!
0 votes
Cast Vote
⛶
Neutral
Feedback for Europe
Work together
One EU

NOTES
00:19 06/02/2026
Reduce dependency on America and open up relations with every country in the world!
⛶
AI
Neutral
They've beaten us to it, of course they would! @OpenAI @ChatGPT now offering @Codex - allowing you to plugin ChatGPT bots into coding environments.

It's not what we expect from the surface, but it can only get better and one day, we'll release our version, one you can talk to, test updates before they happen and run the update live!

We're super excited for this technology, because we know it's going to transfer everything, from apps that heal themselves, right up to making tweaks. TXTWRK will be installing it as soon as we can, ensuring we build in a brand new way, regardless of coding skills or disabilities.

Learn more about industry taking storm via https://chatgpt.com/codex

🗖 VIEW
⛶
Politics
Neutral
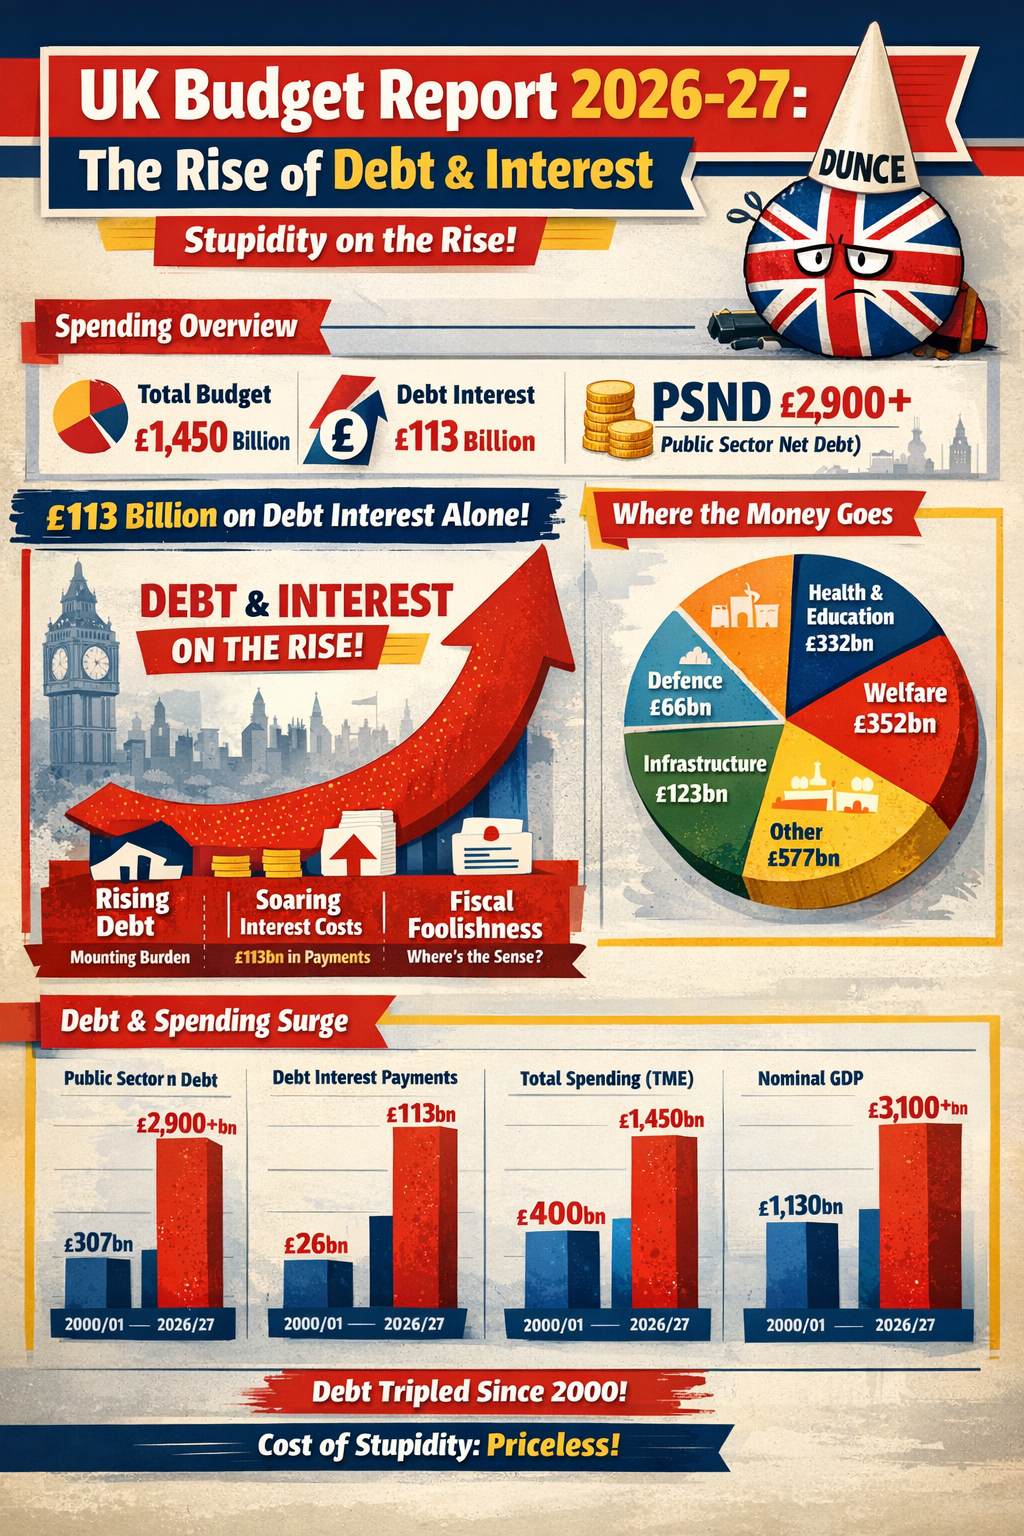
UK Budget Report for Fiscal Year 2026-27: Comprehensive Breakdown

•113 Billion out of 1450 billion spending - debt is on the rise, interest on debt on the rise, after years of lies *

This report provides a detailed overview of the UK government's planned and forecast public spending for the fiscal year 2026-27 (April 2026 to March 2027), based on the latest available data as of February 5, 2026. The primary sources are the Spending Review 2025 (SR25, published June 2025), which sets multi-year Departmental Expenditure Limits (DEL) for controllable spending, and the Office for Budget Responsibility's (OBR) Economic and Fiscal Outlook from November 2025, which forecasts Total Managed Expenditure (TME) including Annually Managed Expenditure (AME). No major updates have occurred since November 2025, as the next Spring Budget is expected in March 2026.

Key priorities from SR25 include front-loaded investment in health, defense, education, and infrastructure to support economic renewal, while constraining day-to-day spending to meet fiscal rules (e.g., public sector net debt falling as a % of GDP in the fifth year). Total spending growth is modest, with DEL increasing by an average of 2.3% per year in real terms over the SR period. AME is demand-driven and subject to economic variables like inflation and caseloads.

1. National Spending Overview

UK public spending is divided into:
•Departmental Expenditure Limits (DEL): Planned budgets for departments and devolved administrations (controllable).
•Annually Managed Expenditure (AME): Demand-led items like welfare and debt interest (forecast, not fixed).
•Total Managed Expenditure (TME): DEL + AME = overall public spending.

From OBR forecasts:
•TME: £1,416 billion (44.7% of GDP).
•DEL: £669 billion (21.1% of GDP).
•AME: £747 billion (23.6% of GDP).

These figures reflect revisions since the March 2025 OBR outlook, with TME £26 billion higher due to higher welfare (£9 billion from inflation and caseloads), policy effects (£16 billion), and other factors. No revisions since November 2025.

Table 1: High-Level Spending Categories for 2026-27 (£ billion, current prices)

CategoryAmount% of GDPDescription
Total DEL66921.1Controllable spending on services and investment (details below).
- Resource DEL (RDEL, day-to-day excluding depreciation)54617.2Operational costs like salaries and programs; increased £1.5 billion due to policy changes.
- Capital DEL (CDEL, investment)1233.9Infrastructure, buildings, equipment; includes £122.6 billion in public sector gross investment (PSGI).
Total AME74723.6Demand-led; declining slightly as % of GDP due to time-limited items offsetting welfare/debt rises (details in Section 3).
Total TME1,41644.7Full public spending; up from £1,370 billion in 2025-26, driven by DEL growth and AME pressures.
#### 2. Departmental Expenditure Limits (DEL) Breakdown
SR25 sets DEL for departments and devolved governments, with totals front-loaded for growth (e.g., £3.3 billion capital brought forward to 2026-27). Figures are in current prices; health, education, and defense receive the largest uplifts. Devolved block grants are the largest in real terms since 1998, averaging £92.5 billion per year across 2026-29 (20% higher per head than equivalent UK spending).

Table 2: Major Departmental DEL Allocations for 2026-27 (£ billion)

Department/AreaTotal DELResource DELCapital DELKey Priorities/Notes
Health and Social Care (DHSC)22521114NHS recovery, elective care, technology; £29 billion real-terms rise over SR period.
Education (DfE)107989Schools funding up £2 billion real terms; skills for 65,000 extra learners; school rebuilding.
Defence664026Towards 2.6% GDP by 2027; nuclear (£15 billion), munitions (£6 billion), infrastructure (£7 billion).
Transport (excl. HS2)25817£15.6 billion by 2031-32 for city regions; Transpennine upgrade (£3.5 billion).
Home Office23212Border security (£280 million extra by 2028-29).
Justice1513214,000 prison places (£7 billion over period).
Science, Innovation & Technology16115R&D partnerships (£410 million); UKRI (£8.8 billion).
Energy Security & Net Zero1028CCUS (£20 billion); hydrogen/renewables.
Environment, Food & Rural Affairs853Farming transitions, flood defenses.
Foreign, Commonwealth & Development1073Aid at 0.3% GNI by 2027-28 (reduced from prior; saves £4.8 billion in 2026-27 for domestic use).
Work & Pensions12111Operational costs only (welfare in AME).
MHCLG (Housing & Communities)14410Affordable Homes Programme (£39 billion over 10 years).
MHCLG (Local Government)15150Core for English councils (details in Section 4).
HS2 (Transport)707Continued delivery.
Reserves & Other11+7+3+Includes Growth Mission Fund (£0.1 billion).
Devolved Block Grants (Total)897712Flexible for devolved services (breakdown below).
- Scotland50437+£2.4 billion resource/£0.51 billion capital via Barnett; naval base (£250 million), hydrogen.
- Wales22184+£1.4 billion resource/£0.2 billion capital; rail (£445 million), coal tips (£118 million).
- Northern Ireland19163+£1 billion resource/£0.22 billion capital; restoration (£469 million), security (£113 million), Casement Park (£50 million).
Totals approximate and may not sum due to rounding/minor items. Figures derived from SR25 aggregates and OBR alignments.

3. Annually Managed Expenditure (AME) Breakdown

AME is forecast by OBR and includes welfare (separate from departmental DEL), pensions, debt interest, and other items. It's the largest driver of TME growth, with welfare up £9.8 billion vs. prior forecast due to inflation, caseloads, and policy reversals (e.g., PIP gateway, winter fuel eligibility). No merging with other areas—welfare is distinct.

Table 3: AME Components for 2026-27 (£ billion)

ComponentAmountDetails/Notes
Welfare (Total)35211.1% of GDP; up £9.8 billion vs. March 2025. Includes: Pensioner (£169), UC/legacy (£98), Disability (£50), Child Benefit (£14), Other (£22). Inside cap (£175), outside (£177). Health/disability subset (£90: £6 children, £67 working-age, £17 pensioners). Policy increases: £4.7 billion. Scottish adjustment: +£6.4 billion for cap.
Pensions (State & Public Sector)190State pensions via triple lock (offset by age rise to 67 in 2026-28); unfunded public pensions net surplus (~£0-4 billion); funded schemes (£21). Included in welfare pensioner spending.
Debt Interest (Net of APF)1133.6% of GDP; up £1.9 billion vs. March (RPI inflation £6 billion offset by policy -£0.8 billion).
Locally Financed Expenditure9Capital in PSGI AME.
Student Loans3In PSGI AME.
Other PSGI AME6Various investments.
Other PSCE AME8Miscellaneous.
Public Corporations & PSNB-NeutralVariesIncluded in totals.
Total AME747Declines as % of GDP due to offsets, but pressures from welfare/debt.
#### 4. Local and Regional Spending
Local spending focuses on English local authorities and devolved nations. SR25 emphasizes devolution, with integrated settlements for ~40% of England's population from 2026-27 (e.g., mayors in North/Midlands).

English Local Government: The Provisional Local Government Finance Settlement (December 2025) sets Core Spending Power (CSP)—flexible funding from grants, council tax, business rates—at £77.7 billion for 2026-27 (up 5.7% from 2025-26, assuming max council tax rise of 4.99%). This is a 3.5% real-terms increase after inflation. Multi-year to 2028-29 (£84.6 billion). Includes £2.4 billion extra for social care/NICs. Consultation closed January 2026; final expected early 2026.

Table 4: English CSP by Authority Type for 2026-27 (£ billion, approximate)

Authority TypeCSP AmountNotes
Metropolitan Districts15.5Urban focus.
Unitary Authorities20.2Broad services.
London Boroughs9.8High transport/deprivation.
County Councils12.6Rural/social care.
Other (e.g., Fire)8.0Specialized.
Total CSP77.7Up from £73.5 billion in 2025-26; 7.4% cash increase from 2024-25 baseline.
Regional Variations: No exact 2026-27 per-head projections in SR25/OBR, but patterns follow historical/needs-based formulas (e.g., deprivation via Fair Funding Review). From OBR and IFS analysis: Higher in deprived/urban areas. Overall CSP grows 8.8% real terms by 2028-29 (7.4% per resident after population growth). Redistribution favors deprived councils: Most deprived decile +15.4% real terms by 2028-29; least deprived +0.8%. Per-head gap widens to 46% higher in most deprived vs. least.

Table 5: Projected Regional Funding Pressures/Shortfalls by 2026-27 (£ billion, estimates from analysis)

RegionShortfall EstimatePer Person ImpactNotes
London & South East3.9£209 (London)Highest shortfalls; deprivation focus in reforms.
North of England2.3Varies (£103 South West proxy)Lower per head historically but gaining from redistribution.
Other Regions3.1 (total rest)Lower in South West (£103)Stable differences; urban/deprived areas prioritized.
Additional regional initiatives: £15.6 billion transport fund by 2031-32 (North/Midlands focus); £410 million Local Innovation Fund; £2.3 billion Local Transport Grant.

---
•Public sector net debt (PSND excluding banks): The stock of debt owed (absolute £ billion).
•Total Managed Expenditure (TME): Total public spending (absolute £ billion).
•Debt interest payments (net of APF where applicable): Cost of servicing the debt (absolute £ billion).
•Nominal GDP: Size of the economy (absolute £ billion).

Data pulled from consistent sources like OBR Public Finances Databank, ONS series, and recent forecasts (e.g., OBR November 2025 for latest years). Figures are approximate/rounded for key years; recent ones provisional or forecast. Financial years (e.g., 2000/01 ends March 2001).

Table: UK Debt, Spending, Debt Servicing, and GDP Since 2000 (£ billion, current prices)

Financial YearPSND ex Banks (£bn)TME (Total Spending, £bn)Debt Interest (£bn)Nominal GDP (£bn)Key Notes
2000/01~307~384~26~1,130Low debt era pre-crisis.
2005/06~474~550–570~27~1,430Gradual rise.
2007/08~544~620–630~32~1,600Pre-financial crisis.
2009/10~995~700–720~26–32~1,570Crisis spike begins.
2010/11~1,139~690–700~39~1,650Austerity starts.
2015/16~1,575~740–750~34~1,960Debt peaks in austerity.
2019/20~1,798~890–900~37~2,140Pre-pandemic.
2020/21~2,138~1,050–1,100~22~2,090Pandemic explosion.
2021/22~2,503~1,000–1,050~25~2,330High debt, low interest.
2022/23~2,631~1,150–1,200~112 (peak)~2,410Interest spike from inflation/rates.
2023/24~2,747~1,250–1,300~28–110 (varied)~2,500Interest volatile.
2024/25 (prov.)~2,761–2,916~1,288–1,370~106–111~2,600–2,700Debt ~95% GDP equiv.
2025/26 (forecast)~2,804–2,900+~1,370–1,416~111~3,000+OBR Nov 2025: Debt rising slightly.
2026/27 (forecast)~2,900+~1,450+ (projected)~110–120 (est.)~3,100+Continued pressures.
### Quick Raw Insights (Absolute £ Billion Trends)
•Debt stock (PSND ex banks): From ~£307 billion in 2000/01 → ~£2,900+ billion now/forecast. Tripled+ in absolute terms over 25 years (crisis, pandemic, energy shocks drove jumps of £500–800bn in short bursts).
•Total spending (TME): From ~£380–400 billion → ~£1,400 billion+. Roughly quadrupled nominally (inflation + real growth + crises pushed big jumps, e.g., +£200–300bn in pandemic year).
•Debt interest payments: From ~£25–30 billion → peaked at £112 billion in 2022/23, now ~£106–111 billion (higher absolute cost despite QE offsets earlier; inflation-linked gilts hurt).
•Nominal GDP: From ~£1,100–1,200 billion → ~£3,000+ billion. Economy grew ~2.5–3x nominally, but debt grew faster.

These are the straight cash numbers—no % deception. Latest provisional debt ~£2,936 billion (Dec 2025 ONS/Trading Economics). Forecasts from OBR Nov 2025 show debt still climbing in absolute terms short-term before any stabilisation.


🗖 VIEW
Do you trust the government?
Select up to 1
1 people have voted
No it's not a concern
1 votes
Yes of course
0 votes
Sometimes
0 votes
I've got no choice
0 votes
Cast Vote
NOTES
20:34 05/02/2026
Sooner or later, we will not be able to reverse debt. That's why we've got to hold our UK government accountable. We will not end up like America, living and breathing in debt.

Table A — Major Economies: Government Debt (GBP, £ trillion)


(General government gross debt, approx, rounded)

YearUnited StatesJapanChinaUnited KingdomFranceGermanyItalyCanadaIndiaBrazil
20004.64.80.40.40.70.80.90.50.30.4
20056.26.40.90.61.21.01.30.70.50.6
20109.07.62.01.31.61.61.91.10.90.9
201513.88.34.21.82.12.02.31.41.41.2
202021.09.18.52.52.62.42.62.02.21.4
202530.67.914.93.33.12.62.82.12.71.6
What jumps out
•The US alone adds ~£26 trillion since 2000.
•UK debt grows 8×.
•China goes from statistical rounding error → £15tn in 25 years.
•Japan is already maxed by 2000 — everything after is inertia.

---

Table B — Poor / Emerging Economies: Government Debt (GBP, £ billion)


(Same structure, smaller scale — billions not trillions)

YearNigeriaPakistanEgyptBangladeshKenyaGhanaSri LankaEthiopiaNepalMalawi
200020355520679521
2005184075228912732
20102855120301512181143
20154580180452522351865
2020851402808055457535129
20251202004801209065100551814
What jumps out
•These countries add debt fast, but in tiny absolute terms compared to rich states.
•Entire regions owe less than one year of US borrowing.
•The crisis isn’t “how much” — it’s currency mismatch + interest + revenue base.
⛶
Careers
Neutral
We're planning on making it easier for anyone to volunteer with any channel on TXTWRK, by simply enabling people to post from their personal channel post box, versus the method of transmitting data for review via other methods.

This makes the process a lot easier, as discovered in @DerbyCollege, we need to ensure volunteers have an easy way to post on behalf of organisations/communities. This is one of the solutions in that journey and one day, you could be posting information via our checklist technology instead - that's a plan down the line, subject to further research & analysis.

https://txtwrk.com/info.php?type=todo&id=334