















































UK Budget Report for Fiscal Year 2026-27: Comprehensive Breakdown
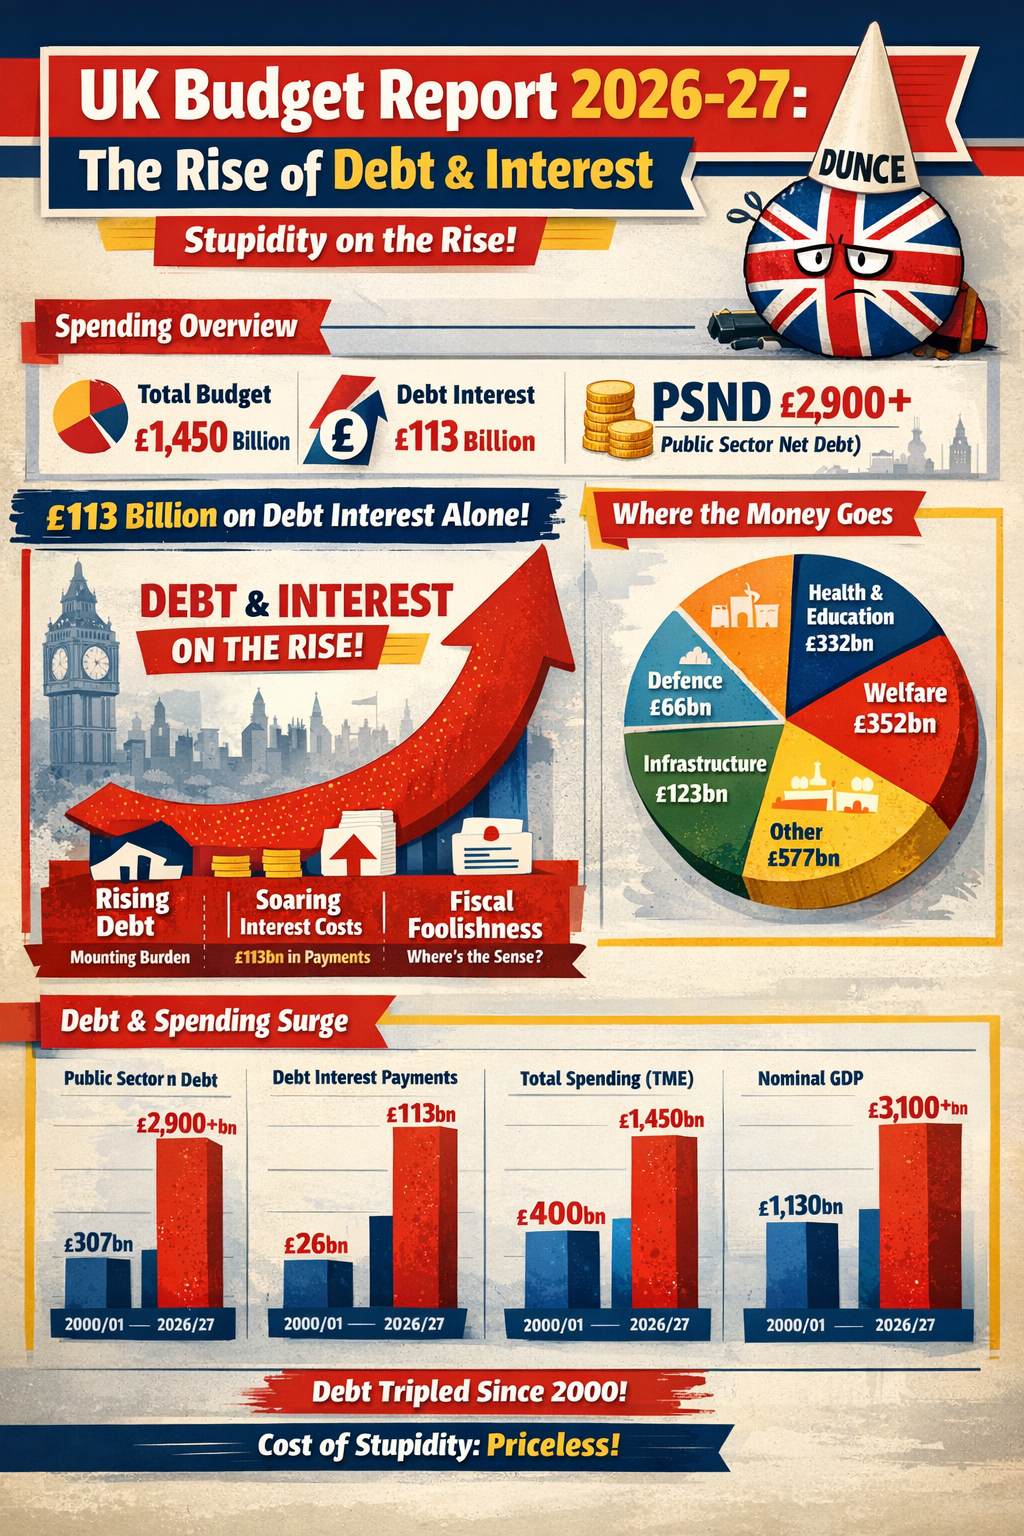
•113 Billion out of 1450 billion spending - debt is on the rise, interest on debt on the rise, after years of lies *
This report provides a detailed overview of the UK government's planned and forecast public spending for the fiscal year 2026-27 (April 2026 to March 2027), based on the latest available data as of February 5, 2026. The primary sources are the Spending Review 2025 (SR25, published June 2025), which sets multi-year Departmental Expenditure Limits (DEL) for controllable spending, and the Office for Budget Responsibility's (OBR) Economic and Fiscal Outlook from November 2025, which forecasts Total Managed Expenditure (TME) including Annually Managed Expenditure (AME). No major updates have occurred since November 2025, as the next Spring Budget is expected in March 2026.
Key priorities from SR25 include front-loaded investment in health, defense, education, and infrastructure to support economic renewal, while constraining day-to-day spending to meet fiscal rules (e.g., public sector net debt falling as a % of GDP in the fifth year). Total spending growth is modest, with DEL increasing by an average of 2.3% per year in real terms over the SR period. AME is demand-driven and subject to economic variables like inflation and caseloads.
1. National Spending Overview
UK public spending is divided into:
•Departmental Expenditure Limits (DEL): Planned budgets for departments and devolved administrations (controllable).
•Annually Managed Expenditure (AME): Demand-led items like welfare and debt interest (forecast, not fixed).
•Total Managed Expenditure (TME): DEL + AME = overall public spending.
From OBR forecasts:
•TME: £1,416 billion (44.7% of GDP).
•DEL: £669 billion (21.1% of GDP).
•AME: £747 billion (23.6% of GDP).
These figures reflect revisions since the March 2025 OBR outlook, with TME £26 billion higher due to higher welfare (£9 billion from inflation and caseloads), policy effects (£16 billion), and other factors. No revisions since November 2025.
Table 1: High-Level Spending Categories for 2026-27 (£ billion, current prices)
| Category | Amount | % of GDP | Description |
|---|---|---|---|
| Total DEL | 669 | 21.1 | Controllable spending on services and investment (details below). |
| - Resource DEL (RDEL, day-to-day excluding depreciation) | 546 | 17.2 | Operational costs like salaries and programs; increased £1.5 billion due to policy changes. |
| - Capital DEL (CDEL, investment) | 123 | 3.9 | Infrastructure, buildings, equipment; includes £122.6 billion in public sector gross investment (PSGI). |
| Total AME | 747 | 23.6 | Demand-led; declining slightly as % of GDP due to time-limited items offsetting welfare/debt rises (details in Section 3). |
| Total TME | 1,416 | 44.7 | Full public spending; up from £1,370 billion in 2025-26, driven by DEL growth and AME pressures. |
SR25 sets DEL for departments and devolved governments, with totals front-loaded for growth (e.g., £3.3 billion capital brought forward to 2026-27). Figures are in current prices; health, education, and defense receive the largest uplifts. Devolved block grants are the largest in real terms since 1998, averaging £92.5 billion per year across 2026-29 (20% higher per head than equivalent UK spending).
Table 2: Major Departmental DEL Allocations for 2026-27 (£ billion)
| Department/Area | Total DEL | Resource DEL | Capital DEL | Key Priorities/Notes |
|---|---|---|---|---|
| Health and Social Care (DHSC) | 225 | 211 | 14 | NHS recovery, elective care, technology; £29 billion real-terms rise over SR period. |
| Education (DfE) | 107 | 98 | 9 | Schools funding up £2 billion real terms; skills for 65,000 extra learners; school rebuilding. |
| Defence | 66 | 40 | 26 | Towards 2.6% GDP by 2027; nuclear (£15 billion), munitions (£6 billion), infrastructure (£7 billion). |
| Transport (excl. HS2) | 25 | 8 | 17 | £15.6 billion by 2031-32 for city regions; Transpennine upgrade (£3.5 billion). |
| Home Office | 23 | 21 | 2 | Border security (£280 million extra by 2028-29). |
| Justice | 15 | 13 | 2 | 14,000 prison places (£7 billion over period). |
| Science, Innovation & Technology | 16 | 1 | 15 | R&D partnerships (£410 million); UKRI (£8.8 billion). |
| Energy Security & Net Zero | 10 | 2 | 8 | CCUS (£20 billion); hydrogen/renewables. |
| Environment, Food & Rural Affairs | 8 | 5 | 3 | Farming transitions, flood defenses. |
| Foreign, Commonwealth & Development | 10 | 7 | 3 | Aid at 0.3% GNI by 2027-28 (reduced from prior; saves £4.8 billion in 2026-27 for domestic use). |
| Work & Pensions | 12 | 11 | 1 | Operational costs only (welfare in AME). |
| MHCLG (Housing & Communities) | 14 | 4 | 10 | Affordable Homes Programme (£39 billion over 10 years). |
| MHCLG (Local Government) | 15 | 15 | 0 | Core for English councils (details in Section 4). |
| HS2 (Transport) | 7 | 0 | 7 | Continued delivery. |
| Reserves & Other | 11+ | 7+ | 3+ | Includes Growth Mission Fund (£0.1 billion). |
| Devolved Block Grants (Total) | 89 | 77 | 12 | Flexible for devolved services (breakdown below). |
| - Scotland | 50 | 43 | 7 | +£2.4 billion resource/£0.51 billion capital via Barnett; naval base (£250 million), hydrogen. |
| - Wales | 22 | 18 | 4 | +£1.4 billion resource/£0.2 billion capital; rail (£445 million), coal tips (£118 million). |
| - Northern Ireland | 19 | 16 | 3 | +£1 billion resource/£0.22 billion capital; restoration (£469 million), security (£113 million), Casement Park (£50 million). |
3. Annually Managed Expenditure (AME) Breakdown
AME is forecast by OBR and includes welfare (separate from departmental DEL), pensions, debt interest, and other items. It's the largest driver of TME growth, with welfare up £9.8 billion vs. prior forecast due to inflation, caseloads, and policy reversals (e.g., PIP gateway, winter fuel eligibility). No merging with other areas—welfare is distinct.
Table 3: AME Components for 2026-27 (£ billion)
| Component | Amount | Details/Notes |
|---|---|---|
| Welfare (Total) | 352 | 11.1% of GDP; up £9.8 billion vs. March 2025. Includes: Pensioner (£169), UC/legacy (£98), Disability (£50), Child Benefit (£14), Other (£22). Inside cap (£175), outside (£177). Health/disability subset (£90: £6 children, £67 working-age, £17 pensioners). Policy increases: £4.7 billion. Scottish adjustment: +£6.4 billion for cap. |
| Pensions (State & Public Sector) | 190 | State pensions via triple lock (offset by age rise to 67 in 2026-28); unfunded public pensions net surplus (~£0-4 billion); funded schemes (£21). Included in welfare pensioner spending. |
| Debt Interest (Net of APF) | 113 | 3.6% of GDP; up £1.9 billion vs. March (RPI inflation £6 billion offset by policy -£0.8 billion). |
| Locally Financed Expenditure | 9 | Capital in PSGI AME. |
| Student Loans | 3 | In PSGI AME. |
| Other PSGI AME | 6 | Various investments. |
| Other PSCE AME | 8 | Miscellaneous. |
| Public Corporations & PSNB-Neutral | Varies | Included in totals. |
| Total AME | 747 | Declines as % of GDP due to offsets, but pressures from welfare/debt. |
Local spending focuses on English local authorities and devolved nations. SR25 emphasizes devolution, with integrated settlements for ~40% of England's population from 2026-27 (e.g., mayors in North/Midlands).
English Local Government: The Provisional Local Government Finance Settlement (December 2025) sets Core Spending Power (CSP)—flexible funding from grants, council tax, business rates—at £77.7 billion for 2026-27 (up 5.7% from 2025-26, assuming max council tax rise of 4.99%). This is a 3.5% real-terms increase after inflation. Multi-year to 2028-29 (£84.6 billion). Includes £2.4 billion extra for social care/NICs. Consultation closed January 2026; final expected early 2026.
Table 4: English CSP by Authority Type for 2026-27 (£ billion, approximate)
| Authority Type | CSP Amount | Notes |
|---|---|---|
| Metropolitan Districts | 15.5 | Urban focus. |
| Unitary Authorities | 20.2 | Broad services. |
| London Boroughs | 9.8 | High transport/deprivation. |
| County Councils | 12.6 | Rural/social care. |
| Other (e.g., Fire) | 8.0 | Specialized. |
| Total CSP | 77.7 | Up from £73.5 billion in 2025-26; 7.4% cash increase from 2024-25 baseline. |
Table 5: Projected Regional Funding Pressures/Shortfalls by 2026-27 (£ billion, estimates from analysis)
| Region | Shortfall Estimate | Per Person Impact | Notes |
|---|---|---|---|
| London & South East | 3.9 | £209 (London) | Highest shortfalls; deprivation focus in reforms. |
| North of England | 2.3 | Varies (£103 South West proxy) | Lower per head historically but gaining from redistribution. |
| Other Regions | 3.1 (total rest) | Lower in South West (£103) | Stable differences; urban/deprived areas prioritized. |
---
•Public sector net debt (PSND excluding banks): The stock of debt owed (absolute £ billion).
•Total Managed Expenditure (TME): Total public spending (absolute £ billion).
•Debt interest payments (net of APF where applicable): Cost of servicing the debt (absolute £ billion).
•Nominal GDP: Size of the economy (absolute £ billion).
Data pulled from consistent sources like OBR Public Finances Databank, ONS series, and recent forecasts (e.g., OBR November 2025 for latest years). Figures are approximate/rounded for key years; recent ones provisional or forecast. Financial years (e.g., 2000/01 ends March 2001).
Table: UK Debt, Spending, Debt Servicing, and GDP Since 2000 (£ billion, current prices)
| Financial Year | PSND ex Banks (£bn) | TME (Total Spending, £bn) | Debt Interest (£bn) | Nominal GDP (£bn) | Key Notes |
|---|---|---|---|---|---|
| 2000/01 | ~307 | ~384 | ~26 | ~1,130 | Low debt era pre-crisis. |
| 2005/06 | ~474 | ~550–570 | ~27 | ~1,430 | Gradual rise. |
| 2007/08 | ~544 | ~620–630 | ~32 | ~1,600 | Pre-financial crisis. |
| 2009/10 | ~995 | ~700–720 | ~26–32 | ~1,570 | Crisis spike begins. |
| 2010/11 | ~1,139 | ~690–700 | ~39 | ~1,650 | Austerity starts. |
| 2015/16 | ~1,575 | ~740–750 | ~34 | ~1,960 | Debt peaks in austerity. |
| 2019/20 | ~1,798 | ~890–900 | ~37 | ~2,140 | Pre-pandemic. |
| 2020/21 | ~2,138 | ~1,050–1,100 | ~22 | ~2,090 | Pandemic explosion. |
| 2021/22 | ~2,503 | ~1,000–1,050 | ~25 | ~2,330 | High debt, low interest. |
| 2022/23 | ~2,631 | ~1,150–1,200 | ~112 (peak) | ~2,410 | Interest spike from inflation/rates. |
| 2023/24 | ~2,747 | ~1,250–1,300 | ~28–110 (varied) | ~2,500 | Interest volatile. |
| 2024/25 (prov.) | ~2,761–2,916 | ~1,288–1,370 | ~106–111 | ~2,600–2,700 | Debt ~95% GDP equiv. |
| 2025/26 (forecast) | ~2,804–2,900+ | ~1,370–1,416 | ~111 | ~3,000+ | OBR Nov 2025: Debt rising slightly. |
| 2026/27 (forecast) | ~2,900+ | ~1,450+ (projected) | ~110–120 (est.) | ~3,100+ | Continued pressures. |
•Debt stock (PSND ex banks): From ~£307 billion in 2000/01 → ~£2,900+ billion now/forecast. Tripled+ in absolute terms over 25 years (crisis, pandemic, energy shocks drove jumps of £500–800bn in short bursts).
•Total spending (TME): From ~£380–400 billion → ~£1,400 billion+. Roughly quadrupled nominally (inflation + real growth + crises pushed big jumps, e.g., +£200–300bn in pandemic year).
•Debt interest payments: From ~£25–30 billion → peaked at £112 billion in 2022/23, now ~£106–111 billion (higher absolute cost despite QE offsets earlier; inflation-linked gilts hurt).
•Nominal GDP: From ~£1,100–1,200 billion → ~£3,000+ billion. Economy grew ~2.5–3x nominally, but debt grew faster.
These are the straight cash numbers—no % deception. Latest provisional debt ~£2,936 billion (Dec 2025 ONS/Trading Economics). Forecasts from OBR Nov 2025 show debt still climbing in absolute terms short-term before any stabilisation.
Read More

COMMUNITY
People